Summary
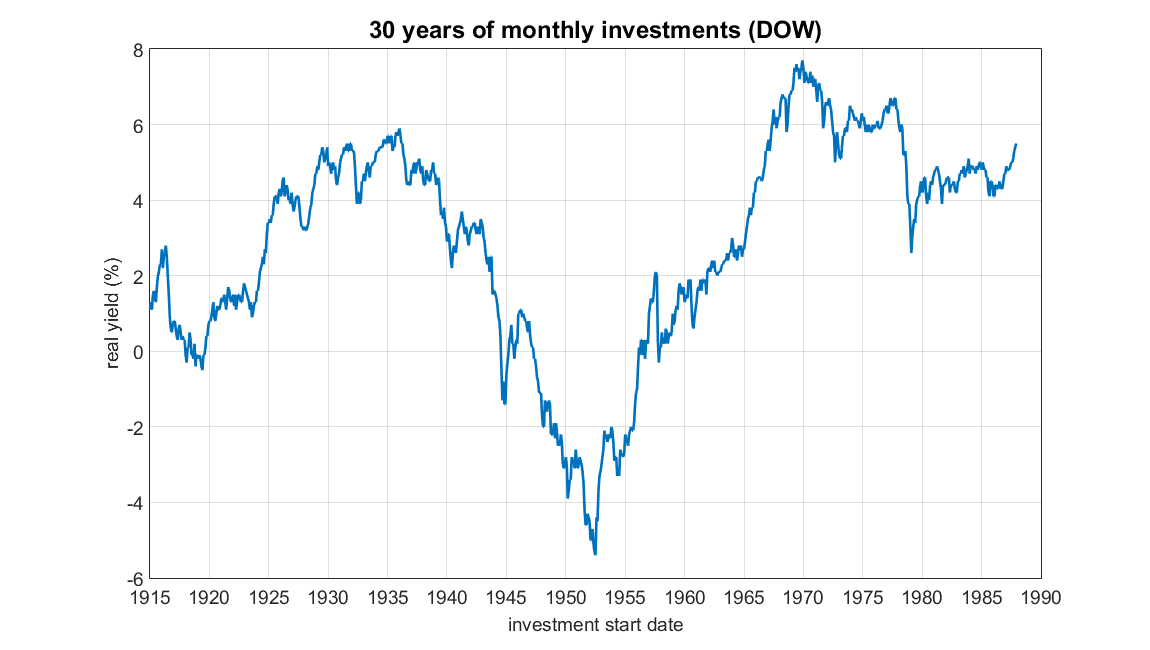
This is a long post, so I'll go ahead and spoil it...the plot above is what an investor would have gotten if they'd invested steadily in a Dow index with no fees for 30 years straight starting at the date on the x-axis. I was expecting much higher returns, and was stunned that a significant % of the time you get net negative yields over 30-year periods. This also doesn't include taxes or fees, so the yields are even worse than what's shown here...
How am I calculating real yield?
Real yield here is the yield adjusted for inflation. The math for determining a compounding rate is:

As a simple example...if you have an investment that triples in 20 years, t = 20, FV/PV = 3, and plugging into a calculator gives you an r of ~5.6%. If inflation in that period means it takes $2 now to buy what used to take $1, then t = 20 and FV/PV = 2 which means r = ~3.5%.
If inflation is 3.5% and raw yield is 5.5%, then real yield (adjusted for inflation) is 1 + 5.5% divided by 1 + 3.5%, or (1.055/1.035), or ~1.9%.
Another way of thinking of it is that real yield is the increase in actual purchasing power. In the example above, your 5.5% yield gave you enough money to buy 1.9% more things. If you want to read more about it, I've written about it previously.
Data sets
I pulled historical Dow and CPI (inflation) values from here and treasury yields from here. The explicit CPI data can be found here.
Algorithm
I assume for this that you invest $100/month, and do so for the specified time period (e.g., 30 years). This is 'dollar cost averaging'. This is a bit complicated since both yield and inflation vary from month to month. The basic algorithm then is:
- start with nothing
- calculate total growth over time period for first month's $100
- calculate inflation adjustment for that money
- add growth*inflation adjustment to the total value
- move to second month
- calculate total growth over remaining time period for second month's $100
- calculate inflation adjustment for that money
- add growth*inflation adjustment to the total value
- repeat until out of months
For growth with Dow, I used the month to month change for the value of the Dow. For treasuries, I used the stated yield since the growth rate is fixed at purchase. For inflation, I compared the effective dollar value between the two months.
As a note, this is mathematically equivalent to correcting the Dow for inflation as the source I listed provides, but treasuries don't work that way with this set so it's worth explaining.
Results
Here are the real yields investors would get starting at the times on the x-axis and investing $100/month in a Dow index for 10 years:

Here is the same thing but for 30 years:
Here is the same thing using a modified algorithm for 30 years...in this algorithm, everything works the same except:
- if Dow did not lose at least 1%, hold that month's $100
- if Dow dropped at least 1%, invest all held money
This is basically buying the dip. Here's the plot compared with the normal 30 year one:

Here is the 30 year plot for 10-year treasuries (i.e., every month you buy $100 worth of 10-year treasuries):

Here is a plot comparing Dow, treasuries, and a mix of 75% Dow/25% treasuries:

Remember...these are all yields adjusted for inflation. For reference, here are the annual inflation values for these time periods:

Discussion
So yeah...inflation was really high during a number of periods in our history, and that really eats away at gains. If you were born in the 1940's or 1950's so that your peak investing years were in the 70's - 90's, you really lucked out apparently. Other time periods seem very hit or miss.
It's also pretty clear that my simple 'buy the dip' strategy doesn't really help or hurt...I experimented with a lot of different variants (need three consecutive months of 0.5% losses, auto-invest after 6 months of no dip, etc.) and could not find one that beat the simple $100/month strategy.
I could not find a broader stock index with data going back this far, so I used the DJIA instead of something like the S&P 500.
If you want to play with the algorithms, I've included my MATLAB code and the data here.
If you want to play with the algorithms, I've included my MATLAB code and the data here.


Slot web is an online casino website. That is open for online slots that are in abundance within a single website. Some websites may have sports betting services or other online casinos as well, so if asked what is a slot website, it will answer that Slot website, it is a form of online casino website. By being the center of the big web slots that are committed to the development of slot games continuously
ReplyDelete